Cash Flow Forecasting Automation: A Practical Guide for Australian Finance Teams (2026)
Ordron28 min read
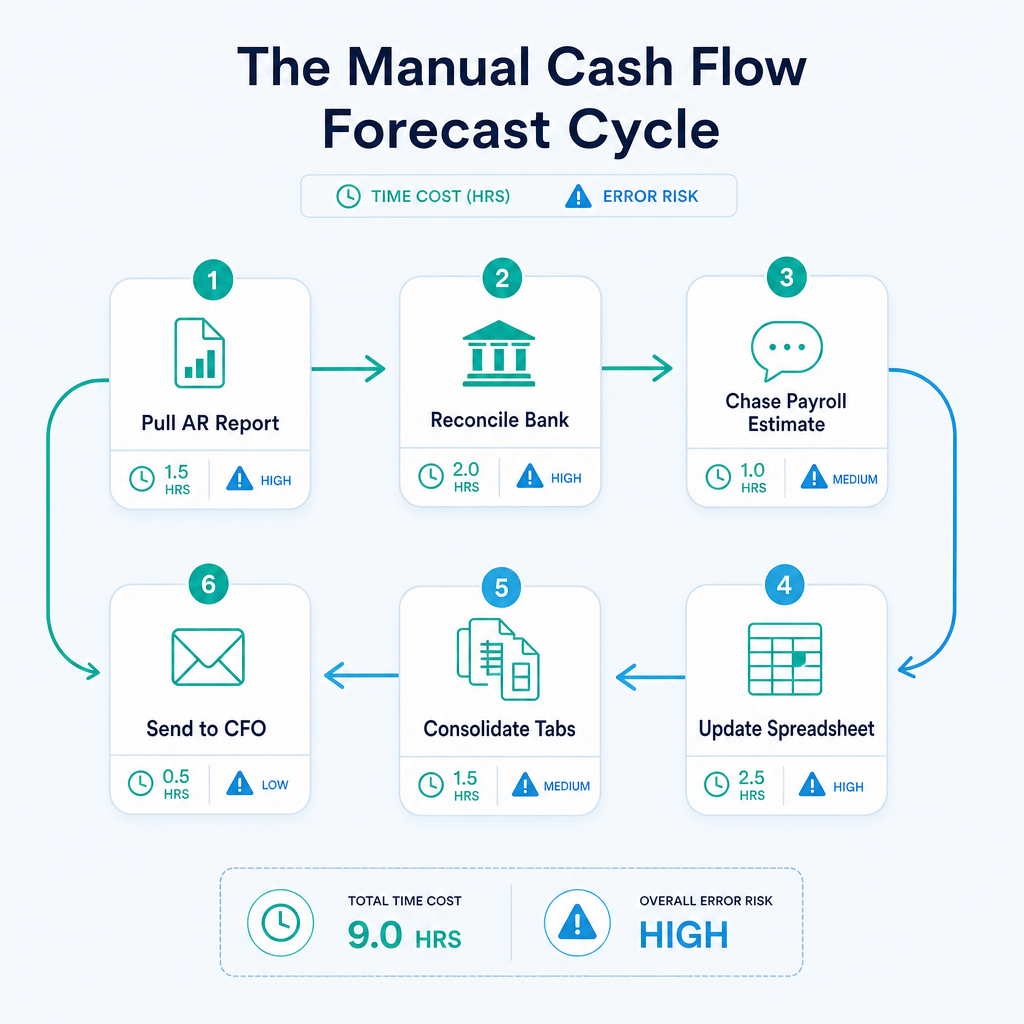
If your finance team rebuilds the cash flow forecast from scratch every week or every month, you already know where the time goes. Someone pulls an AR ageing report from the accounting system, reconciles it against the bank feed, chases down payroll estimates from HR, and then pastes everything into a spreadsheet model that was built three years ago and has seventeen tabs nobody fully understands anymore. By the time the forecast is ready, some of the inputs are already stale. That is not a process problem you can solve by working harder.
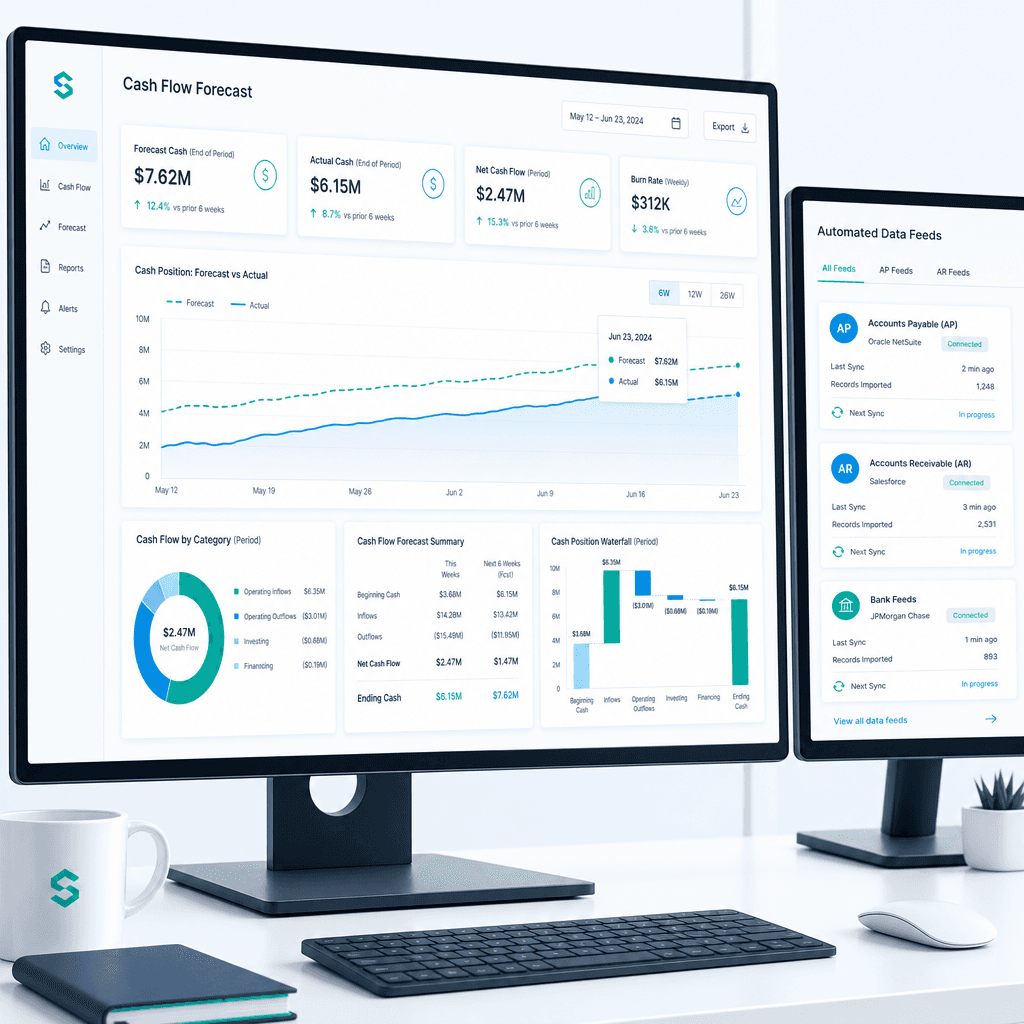
Cash flow forecasting automation fixes this by replacing the manual data-pull-and-paste loop with connected feeds that refresh automatically, flag variances in real time, and give the finance team a forecast that is current when they open it, not current as of last Tuesday. The goal is not a more sophisticated dashboard. The goal is hours returned to the people doing the work, and a forecast number you can actually trust.
This guide is written for CFOs, finance managers, and financial controllers at Australian mid-market and enterprise businesses who are currently building forecasts manually and want a clear, process-level path to automation that does not require ripping out the systems already running the business. I will cover where manual forecasting breaks down, what automation actually involves at the feed level, how to map your current process before touching anything, and how to measure whether the work paid off. No aspirational projections. Just the mechanics, the numbers, and what to watch out for.
Key Takeaways
- Manual cash flow forecasting fails because of stale data and version sprawl, not because finance teams lack skill. Automation fixes the data problem at the source.
- Automating a cash flow forecast means connecting AP, AR, payroll, and bank feeds automatically. It does not mean replacing your ERP or accounting system.
- Mapping the manual steps in your current forecast process before building anything is the most important and most skipped step in any automation project.
- AP automation directly improves forecast accuracy because it surfaces committed spend before invoices hit the ledger.
- Success is measured in hours returned per month, reduction in error rates, and shorter forecast cycle times. Platform sophistication is not the scorecard.
- Australian mid-market finance teams that automate upstream feeds consistently recover meaningful hours per cycle and reduce the manual reconciliation burden that erodes forecast reliability.
Summary Table
| Forecast Input | Manual Process Pain | Automation Approach | Measurable Outcome |
|---|---|---|---|
| Accounts Payable | Invoices coded late or inconsistently, spend not visible until posted | Intelligent document understanding, auto-coding, PO matching | >95% coding accuracy, committed spend visible in forecast before posting |
| Accounts Receivable | AR ageing pulled manually, reconciled against bank by hand | Auto-coded GL tags, automated bank reconciliation, live AR dashboard | 80% reduction in reconciliation time, real-time aged-receivables visibility |
| Payroll | Manual estimates from HR, updated infrequently | Direct feed from payroll system into forecast model | Payroll line updated each cycle without manual re-keying |
| Bank Data | Bank statements downloaded and pasted into model | Direct bank feed integration, automated transaction matching | Zero manual download steps, daily balance refresh |
| Legacy ERP Data | Re-keyed manually between systems, reconciliation errors | RPA bot driving legacy ERP interface, validated against SQL | 160+ hours per month returned, data integrity maintained from go-live |
| Forecast Assembly | Manual consolidation of tabs, version control by filename | Single connected model pulling live feeds, version history automated | Forecast cycle time shortened from days to hours |
Why Manual Cash Flow Forecasting Breaks Down
There is a predictable failure pattern in manual cash flow forecasting, and it shows up across industries and company sizes. It is worth being specific about it, because the failure mode determines what you automate first.
Stale Data at the Point of Decision
A cash flow forecast is only as useful as its inputs are current. When a finance manager pulls an AR ageing report on Monday morning to build the week's forecast, that report reflects balances as of whenever it was last reconciled, which may be Friday or last Wednesday or the previous month-end, depending on how busy the team has been. By the time the forecast reaches the CFO's inbox, the business has already processed transactions that are not in it.
This is not a hypothetical. I worked with a mid-sized freight operator managing accounts receivable for hundreds of recurring clients inside Xero. Bank reconciliation was manual, GL coding was inconsistent, and management had no real-time visibility over aged receivables. The team was technically capable and the process was documented, but the data was always a few days behind. Decisions about whether to draw on the credit facility or hold cash were being made on numbers that were already out of date. After implementing auto-coded GL tags, automated bank reconciliation logic, and a real-time aged-receivables dashboard inside the existing Xero environment, AR reconciliation time fell by 80% and management had live aged-receivables visibility from day one of go-live. The inputs changed. The forecast changed with them.
Version Sprawl and the Spreadsheet Archaeology Problem
Most manual forecasting processes produce multiple versions of the same file. The forecast sent to the board last month lives in a folder somewhere. This month's version is on someone's desktop. The one the CFO edited is in a shared drive with a name like "CashFlow_v4_FINAL_revised_Alex.xlsx". When a variance shows up, reconstructing which version was the basis for which decision takes longer than building the next forecast.
Version sprawl is not a discipline problem. It is what happens when the forecast model has no live connection to its source data. Every time you need current numbers, you rebuild. Every rebuild creates a new version. The only way to stop the proliferation is to make the model pull its data automatically, so rebuilding manually becomes unnecessary.
Error-Prone Consolidation Across Systems
Most mid-market and enterprise businesses run more than one system. There is an ERP or accounting platform, a payroll system, possibly a separate inventory or job-costing tool, and bank feeds that may or may not be reconciled daily. Consolidating data from all of these by hand introduces transcription errors, mismatched periods, and category coding inconsistencies that compound across each cycle.
I saw this directly with a family-owned logistics operator running a twenty-year-old ERP alongside Xero. Finance staff were manually re-keying data between the legacy system and reporting tools every month, which consumed an enormous amount of time and introduced reconciliation errors that took more time to untangle. The solution was not to replace the ERP. It was to build an RPA bot that drives the legacy ERP interface directly, validates extracted data against SQL, and syncs clean records into Xero and reporting dashboards automatically. The ERP stayed exactly where it was. The manual re-keying stopped. The result was 160+ hours per month returned to the finance team, with data integrity maintained across both systems from the first day of go-live.
That outcome is worth sitting with. One hundred and sixty hours per month is four full weeks of one person's time, recovered not by hiring or restructuring, but by stopping the manual work that should never have been manual in the first place.
The Time Cost of Rebuilding Each Cycle
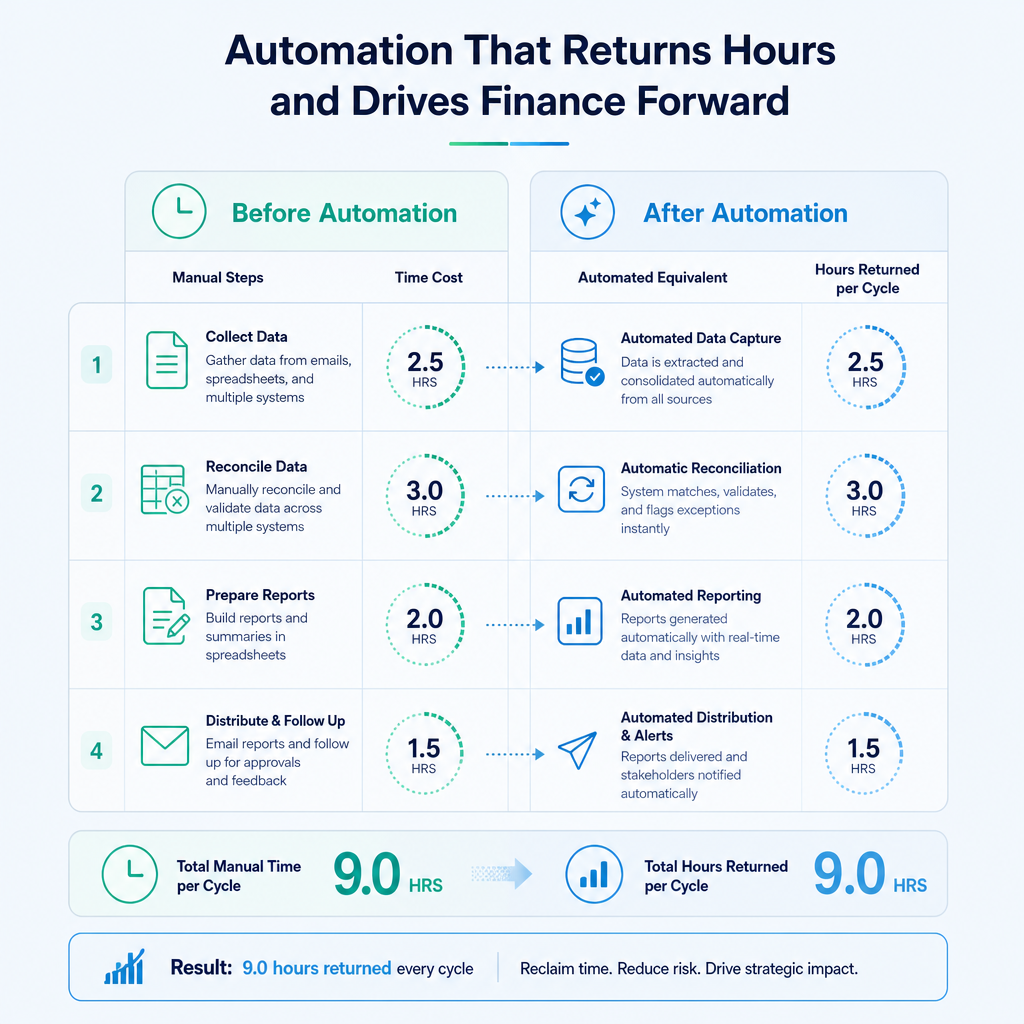
Beyond errors and staleness, there is the raw time cost of the manual process itself. When you add up the hours spent pulling reports, reconciling feeds, updating assumptions, chasing down estimates from other departments, and assembling the final model, a weekly or monthly forecast cycle at a mid-market business easily consumes one to two full days of skilled finance staff time per cycle. Across a year, that is weeks of capacity consumed by data logistics rather than analysis.
The Australian Bureau of Statistics consistently reports that labour productivity in professional services is constrained by administrative burden. Finance teams are not exempt from this. The manual forecast process is a measurable productivity cost, and it grows as the business adds entities, cost centres, and data sources.
What Cash Flow Forecasting Automation Actually Involves
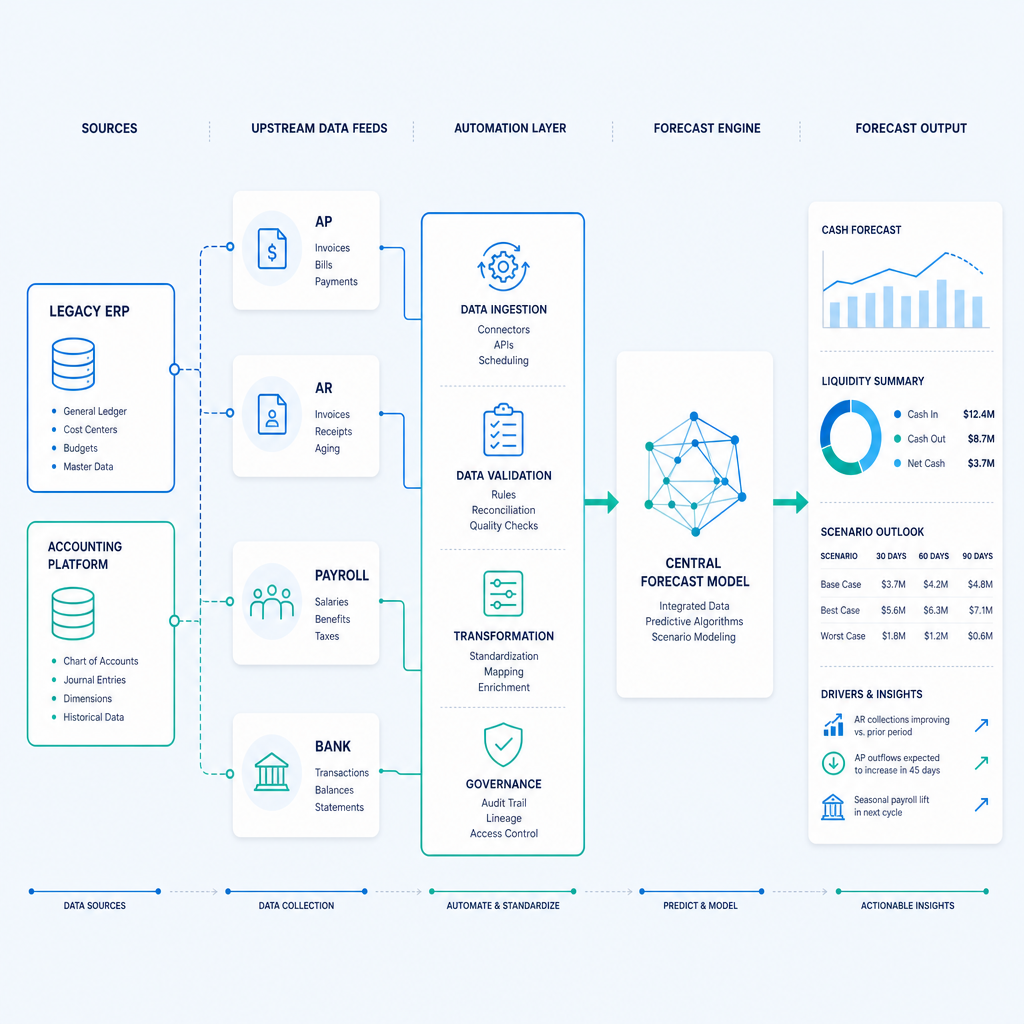
Cash flow forecasting automation means connecting the upstream data sources that feed your forecast so that the model refreshes automatically rather than requiring a human to pull and paste each input every cycle. It is a plumbing problem before it is a technology problem.
The Four Core Feeds
A complete automated cash flow forecast draws from four primary sources:
Accounts Payable. AP data tells the forecast what cash will leave the business and when. An automated AP process captures invoices as they arrive, codes them to the correct cost centre and GL account, matches them against purchase orders, and posts them to the ledger without waiting for a human to process the batch. When AP runs on an exception-only workflow, where the system handles routine invoices automatically and routes only anomalies to a reviewer, the committed spend is visible in the forecast before invoices reach the approval queue. This is one of the most direct connections between AP automation and forecast quality: you are forecasting against actual committed spend, not against last month's actuals extrapolated forward.
Accounts Receivable. AR data tells the forecast what cash will enter the business and when. Automated AR processes include auto-coded bank reconciliation, automated matching of remittance advice to open invoices, and real-time aged-receivables reporting. When these run automatically, the forecast reflects the current collection position rather than the position as of the last manual reconciliation.
Payroll. Payroll is often the largest single cash outflow for a services business and the most predictable. Despite this, most manual forecasting processes still require someone to ask HR for the next payroll estimate. Connecting the payroll system directly to the forecast model eliminates that step and ensures the payroll line reflects actual scheduled runs, including any changes to headcount or hours that have already been confirmed in the payroll platform.
Bank Data. The bank feed is the ground truth for actual cash position. Most modern accounting platforms, including Xero and MYOB, support direct bank feeds. The automation step here is ensuring that the bank feed data flows into the forecast model's opening balance automatically and that transaction categorisation is handled by rules or intelligent matching rather than manual review.
Connecting, Not Replacing
The most common objection I hear from finance managers when the topic of automation comes up is some version of: "We would need to replace our ERP first." This is not correct, and acting on it delays automation gains that are available right now.
Legacy ERPs and established accounting systems exist for real reasons. They hold years of transaction history, they are integrated with operational workflows, and the finance team knows how they behave. Replacing them is expensive, disruptive, and high-risk. The better approach is to build around them, using RPA to drive the legacy interface, using intelligent document understanding to capture and code documents regardless of their format, and using API connectors or file-based integrations to move data into the forecast model without touching the source system.
The work Ordron has shipped across the logistics, manufacturing, and distribution sectors consistently demonstrates that the legacy system does not need to move for the finance team to get their time back. The connector does the work. The ERP stays put.
What Automation Does Not Do
It is worth being clear about what automation does not replace. It does not replace the finance team's judgement about assumptions, seasonality adjustments, or scenario modelling. It does not replace the CFO's read on what a variance means for the business. What it replaces is the data logistics: the pulling, pasting, reconciling, and version-managing that consumes hours without adding any analytical value. Once those tasks are automated, the same finance team can spend their time on the parts of forecasting that actually require human expertise.
Mapping Your Current Forecast Process Before Automating
Before writing a single line of automation logic, map the manual process as it exists today. This step is consistently skipped or rushed, and it is consistently the reason automation projects miss their targets.
Why Process Mapping Comes First
Automation copies the process it is given. If the manual process has redundant steps, inconsistent data sources, or informal workarounds that only two people know about, the automation will faithfully replicate all of those problems at higher speed. Mapping first means you identify the friction points, remove the unnecessary steps, and then automate the clean process rather than the messy one.
It also means you can attach numbers to the problem before you start. How many hours per cycle does each feed currently take? Which inputs are most frequently out of date when the forecast is assembled? Where do errors most commonly appear? Without answers to these questions, you cannot measure whether the automation worked. No aspirational projections survive contact with a baseline you never established.
How to Map the Process
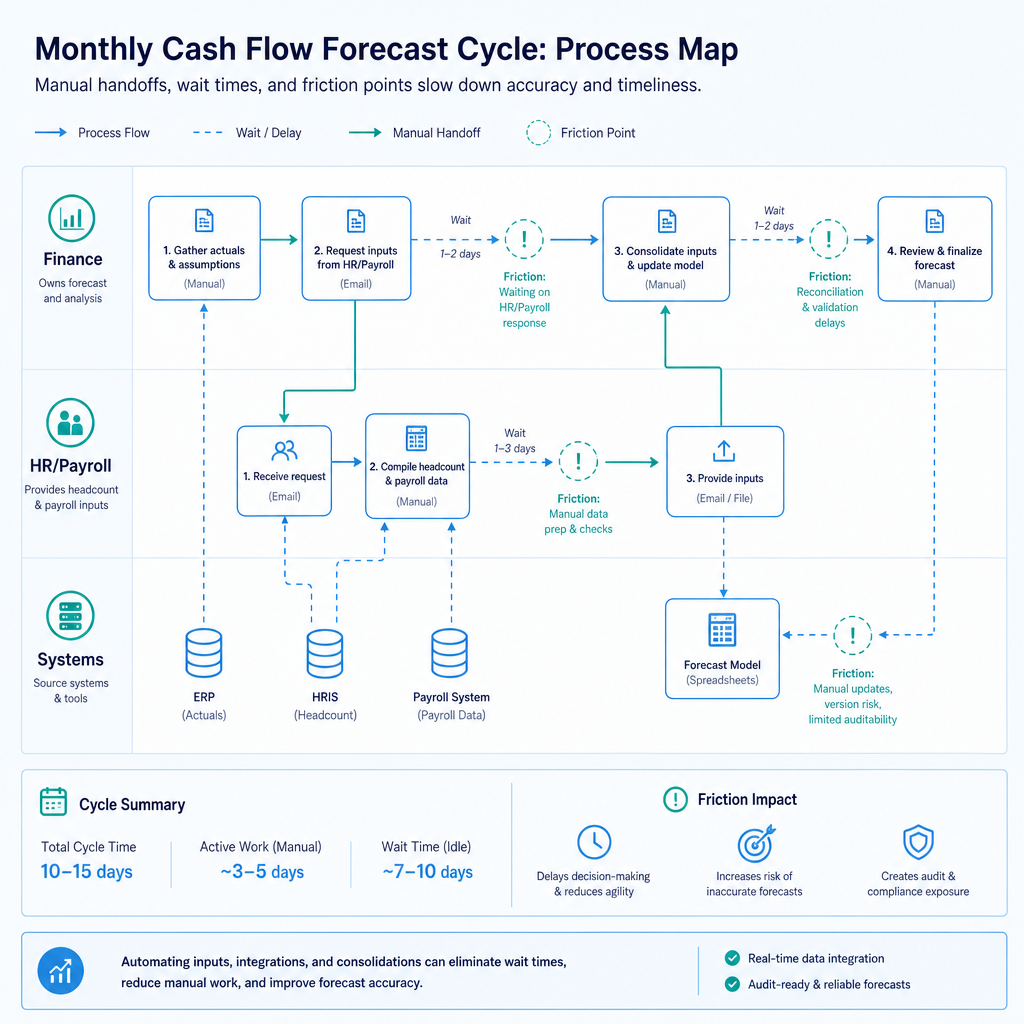
Start with a simple swimlane diagram showing who does what, in what order, and which systems they touch. For each step, record the time it takes, the system or file it touches, the frequency it runs, and the last time a significant error occurred in that step. This does not need to be a formal project. A one-hour session with the two or three people who actually build the forecast each cycle will surface everything you need.
From the map, you are looking for three categories:
High-frequency, low-complexity steps. Data downloads, copy-paste steps, and file transfers that happen every cycle and never require judgement. These are the first candidates for automation. They return the most hours for the least complexity.
High-error, high-consequence steps. Manual coding, cross-system reconciliation, and formula-dependent consolidation steps that have a history of producing errors that take time to find and fix. These are the second priority because the value of getting them right is compounded across every downstream decision that relies on the forecast.
Dependency bottlenecks. Steps that require input from another team or system before they can proceed. Waiting for payroll confirmation, waiting for an AP batch to clear, waiting for a depot to submit its numbers. These are the steps that make the forecast take two days instead of two hours, and they are often the easiest to fix with a direct system connection.
Prioritising the Highest-Friction Inputs
Once the map is complete, rank the feeds by friction. A simple scoring approach: multiply the hours per cycle by the error frequency by the downstream impact on forecast accuracy. The feed with the highest score gets automated first.
For most Australian mid-market businesses, accounts payable is the highest-friction input because it involves the most document volume, the most inconsistency in how documents arrive (email, post, supplier portals, EDI), and the most manual judgement in coding. Automating AP first delivers the most immediate improvement to forecast accuracy and the most hours returned per cycle.
For businesses with large recurring revenue bases, accounts receivable reconciliation often scores equally high. For businesses with large and variable workforces, such as construction, hospitality, or logistics, payroll estimation is frequently the forecast input with the most manual handling and the most cycle-to-cycle variation.
Connecting the Upstream Feeds: AP and AR Automation as Forecast Infrastructure
Why AP Automation Improves Forecast Accuracy at the Source
Accounts payable is not just an operational efficiency problem. It is a forecast accuracy problem. When invoices sit in an inbox waiting to be processed, the committed cash outflow they represent is invisible to the forecast model. The AP ledger shows a lower balance of payables than actually exists, and the forecast projects more available cash than the business actually has.
Automating AP processing means invoices are captured, coded, matched, and posted as they arrive, rather than in batches every few days. The intelligent document understanding layer reads invoices in any format, extracts the relevant fields (vendor, amount, due date, line items), matches against purchase orders where applicable, and codes to the correct GL account and cost centre using learned rules. Exceptions, invoices that do not match a PO, carry unusual amounts, or fall outside expected vendor parameters, are routed to a human reviewer. Everything else posts automatically.
The accuracy numbers from this approach are consistent across engagements. On enterprise AP with high monthly invoice volumes across multiple cost centres, coding accuracy using intelligent document understanding exceeds 95%, and 75% of supplier invoices are fully auto-processed without human intervention. That means three-quarters of the invoice volume flows through to the ledger and into the forecast model without a single manual touch.
The forecast impact is direct. When committed spend is visible in the ledger as it is committed rather than when it is eventually processed, the short-term cash outflow projection becomes materially more accurate. The CFO is looking at real cash obligations, not a lagged approximation.
AR Automation and Collection Visibility
On the receivables side, automated AR processing gives the forecast a current view of what is owed and when it is likely to arrive. Auto-coded bank reconciliation means payments are matched to invoices as they clear, rather than sitting in an unmatched transactions queue until someone has time to work through it. Real-time aged-receivables reporting means the forecast can model collection timing based on actual debtor behaviour, not on a static assumption about average debtor days.
For the freight operator mentioned earlier, implementing automated bank reconciliation and a live AR dashboard inside Xero cut reconciliation time by 80% and gave management live visibility over aged receivables from go-live. The forecast improvement followed directly: the team could see exactly which receivables were current, which were overdue, and which were at risk of extending beyond terms, all without running a manual report. Scenario modelling for cash shortfalls became a ten-minute exercise rather than a half-day rebuild.
Payroll Feed Integration
Payroll is the most predictable of the major cash flows, but it is frequently handled as if it were uncertain. The standard manual process has someone in finance contacting HR or the payroll team at the start of each forecast cycle to get the estimated payroll for the coming period. If headcount has changed, if overtime is running high, or if a pay run timing has shifted, that information may or may not make it into the forecast before it is finalised.
Connecting the payroll system directly to the forecast model eliminates the dependency. The forecast reads scheduled pay runs, confirmed headcount, and any approved variations automatically. The payroll line is current without anyone making a phone call. For businesses running a standard fortnightly or monthly payroll, this is a low-complexity integration with immediate cycle-time benefits.
The Legacy ERP Problem (and Why It Is Not a Blocker)
Many Australian mid-market businesses run accounting or ERP systems that predate modern API standards. These systems do not have webhook integrations or REST APIs. They may export data in proprietary formats, or only through screen-based interfaces. The standard advice from many consultants and software vendors is that these systems need to be upgraded or replaced before automation is viable.
That advice is wrong, and it is expensive.
RPA (robotic process automation) can drive a legacy ERP's user interface directly, exactly as a human would, logging in, navigating to the correct screen, extracting the required data, and passing it downstream, without any modification to the source system. When the extracted data is validated against a reference database before being passed to the forecast model, the accuracy of the feed is maintained regardless of the age of the source system.
The logistics operator running the twenty-year-old ERP alongside Xero is the clearest example I have from our own work. The ERP had no API, no modern export capability, and no vendor support for integration. The RPA bot drives the interface directly, validates against SQL, and syncs clean records into Xero. One hundred and sixty-plus hours per month returned. No ERP replacement. No disruption to the operational system. The automation was shipped around the existing infrastructure, not through it.
Measuring Whether It Worked
If you cannot measure the outcome, you did not set up the engagement correctly. This is not a polite caveat. It is the single biggest failure mode in finance automation projects: work gets shipped, dashboards go live, and six months later nobody can say with confidence whether the team actually got their time back.
Measuring automation outcomes requires three things: a baseline recorded before go-live, the same metrics measured after go-live, and a commitment to publishing the before-and-after numbers regardless of what they show.
Hours Returned Per Cycle
This is the primary metric. Before the engagement begins, record the time each team member spends on each step of the forecast process. Be specific: not "time spent on forecasting" but "time spent downloading and reconciling the AP report", "time spent chasing payroll estimates", "time spent consolidating tabs". After go-live, measure the same steps. The reduction is the hours returned.
For reference: across the work Ordron has shipped in the logistics, manufacturing, and distribution sectors, the maximum manual work reduction achieved in a single engagement is 85%. The largest single hours-returned figure from one engagement is 160 hours per month. These are not projections. They are numbers measured after go-live with the same methodology used to establish the baseline.
For most mid-market finance teams, a realistic target for a well-scoped AP and AR automation engagement is 20 to 40 hours per month returned in the first cycle, rising as the system learns coding patterns and exception rates fall.
Error Rate Reduction
Record the error rate in your current process before starting. This means counting, not estimating. How many coding errors appear in a typical AP batch? How many reconciliation discrepancies require manual investigation each cycle? How many forecast variances are later traced back to a data input error rather than a genuine business variance?
After go-live, run the same count. Coding accuracy above 95% is achievable with intelligent document understanding on structured invoice volumes. An exception-only workflow, where the automation handles routine items and humans review only anomalies, consistently produces lower error rates than a fully manual process because humans are better at reviewing flagged exceptions than at processing high volumes of routine documents under time pressure.
Forecast Cycle Time
Cycle time is the elapsed time from the start of a forecast build to a signed-off, distributable forecast. In a manual process at a mid-market business, this is commonly two to three days. With connected feeds, this compresses to hours. The most significant driver of the reduction is eliminating the waiting time, not the processing time. When every feed updates automatically, the forecast is ready when the finance team sits down to review it, not two days after they start chasing inputs.
A reduction in monthly close cycle duration of 80% is achievable when AP, AR, and bank feeds are all automated. That figure comes from a mid-sized manufacturer running Xero alongside a custom inventory tracker and Excel forecasting models, where the close cycle was cut by 80% through automated feed connections without replacing any of the underlying systems.
What Not to Measure
Do not measure success by the number of integrations built, the number of dashboards deployed, the sophistication of the technology stack, or the number of software licences procured. These are inputs to the process, not outputs from it. A finance team that has a beautiful real-time dashboard but still spends 30 hours per month manually reconciling data has not benefited from automation. The only honest scorecard is hours returned, errors eliminated, and cycle time shortened. Everything else is a proxy.
Common Pitfalls and How to Scope an Engagement Around Outcomes
Pitfall 1: Automating the Wrong Step First
The most common scoping mistake is automating the most visible step rather than the highest-friction step. Dashboard and reporting tools are easy to demo and easy to sell, but if the data feeding the dashboard is still assembled manually, the dashboard is showing you a polished view of a slow, error-prone process. Start with the data feeds. Get the inputs right first. The reporting improves automatically once the inputs are clean and current.
Pitfall 2: Skipping the Baseline
I have covered this above, but it bears repeating because the consequences are significant. Without a recorded baseline, you cannot demonstrate value, you cannot identify whether the automation is performing as expected, and you cannot prioritise the next improvement. Establishing the baseline is a one-time effort of a few hours at the start of the engagement. It is not optional.
Pitfall 3: Treating the First Version as the Final Version
An automated AP coding model improves over time as it processes more invoices and the exception-handling rules are refined. A bank reconciliation automation gets faster as matching rules are tuned to the actual transaction patterns of the business. Scoping an engagement as a one-time build with no provision for post-go-live tuning means leaving a significant portion of the available efficiency on the table. Build in at least 30 to 60 days of post-go-live monitoring and adjustment as a standard part of any automation engagement.
Pitfall 4: Underestimating the Data Quality Step
Automation surfaces data quality problems that the manual process was quietly absorbing. When a human re-keys a figure, they often silently correct obvious errors. When an RPA bot extracts and passes a figure, it passes exactly what is in the source system, including the errors. In the early weeks after go-live, expect to find and fix data quality issues in the source systems. This is not a failure of the automation. It is the automation doing its job correctly. Budget time for it.
Pitfall 5: Overscoping the Initial Build
The fastest path to measurable value is a narrow, well-defined first build that targets the highest-friction input in the forecast process and ships quickly. A project scoped to automate all forecast inputs simultaneously, integrate five systems, and deliver a comprehensive reporting layer will take months to design, longer to build, and may never go live at all if the business changes or the project loses momentum. Find your automation quick wins. Ship the first one. Measure it. Then scope the next.
Scoping Around Outcomes
A well-scoped automation engagement starts with a process map, identifies the top two or three friction points by the hours-times-error-times-impact scoring method, defines the specific before-and-after metrics that will be used to judge success, and ships the first build against those metrics. The engagement is successful when the numbers are better, not when the technology is deployed.
The technology choice is a means. The vendor platform is a means. The integration architecture is a means. The only thing that matters is whether the finance team got their time back, measured after go-live, with the numbers attached.
What an Ordron Assessment Looks Like
An Ordron engagement starts with a structured assessment of the current forecasting process. We map the manual steps, identify the feeds with the most friction, and put specific hour and error-rate numbers against each one. From that assessment, we scope the automation against the specific outcomes the finance team actually needs: hours returned per cycle, coding accuracy targets, cycle time reduction. No platform pitch. No software licence conversation. Just the process, the friction points, and the automation that addresses them.
If you are building your cash flow forecast manually today and want to know exactly how many hours you could get back and where, book an assessment with Ordron at ordron.com. We will map your current process, identify the highest-value automation opportunities, and give you a clear before-and-after projection grounded in the work we have already shipped across comparable businesses in Australia.
References
- Australian Bureau of Statistics. (2026). Australian Industry, 2024-25. ABS. https://www.abs.gov.au/statistics/industry/industry-overview/australian-industry/latest-release
- ACCC. (2026). Small Business in Australia. Australian Competition and Consumer Commission. https://www.accc.gov.au/business/small-business
- Xero. (2026). Xero Bank Feeds: How Automatic Bank Feeds Work. Xero Australia. https://www.xero.com/au/accounting-software/bank-reconciliation/
Frequently asked questions
- What is cash flow forecasting automation?
- Cash flow forecasting automation means connecting the upstream data sources that feed your forecast (AP, AR, payroll, and bank data) so that the model refreshes automatically each cycle rather than requiring a finance team member to manually pull, reconcile, and paste each input. The result is a forecast that is current when it is needed, assembled in hours rather than days, and free from the transcription errors that accumulate in a manual process.
- Do we need to replace our ERP to automate cash flow forecasting?
- No. Legacy ERPs and established accounting systems can be connected to automated forecast feeds using RPA and intelligent connectors that drive the existing interface directly. The source system stays in place. The automation is built around it. Ordron has returned over 160 hours per month to a finance team running a twenty-year-old ERP, with no system replacement required.
- How long does it take to set up automated cash flow forecasting?
- Timeline depends on the number of feeds being connected and the complexity of the source systems. A focused engagement automating a single high-friction feed can be designed, built, and live within four to eight weeks. A broader engagement covering AP, AR, payroll, and bank feeds typically takes two to four months from scoping to go-live. The post-go-live tuning period of 30 to 60 days is where accuracy improves most quickly.
- What are the most important metrics to track after automating cash flow forecasting?
- Three metrics matter: hours returned per cycle compared to the pre-automation baseline, error rate reduction including coding errors and reconciliation discrepancies, and forecast cycle time which is the elapsed time from the start of a build to a signed-off distributable forecast. Do not measure success by the sophistication of the technology stack or the number of integrations built.
- How does AP automation improve cash flow forecast accuracy?
- When AP processing is manual and batched, invoices sit in an inbox for days before they are coded and posted. The forecast model therefore shows a lower payables balance than actually exists, overstating available cash. Automated AP processing captures, codes, and posts invoices as they arrive using an exception-only workflow for anomalies, making committed cash outflows visible in the forecast before they hit the approval queue.
- What is an exception-only workflow in AP automation?
- An exception-only workflow means the automation handles all routine invoice processing automatically including capture, coding, PO matching, and posting, and routes only non-standard items to a human reviewer. On enterprise AP volumes, this approach consistently achieves coding accuracy above 95% and allows 75% of invoices to be fully processed without any human touch.
- Is cash flow forecasting automation suitable for businesses using Xero or MYOB?
- Yes. Both Xero and MYOB support direct bank feeds and have API access that enables automated data extraction and posting. RPA and intelligent document understanding layers can be built on top of either platform to automate AP capture and coding, AR reconciliation, and bank matching without requiring any upgrade or replacement of the underlying accounting system.
- How do we get started with cash flow forecasting automation?
- The first step is mapping your current manual forecast process: who does what, in what order, how long each step takes, and where errors most commonly occur. This baseline is the foundation for scoping any automation engagement. Once the friction points are identified and quantified, you can prioritise the first build, define the success metrics, and scope the work to deliver measurable outcomes rather than technology deployments.
Ordron
Finance automation team, Sydney
Ordron builds the finance automation infrastructure that runs AP, AR, reconciliations and reporting on autopilot for Australian mid-market businesses.
More from the Ordron Insights catalogue
Selected by topic. Updated as the agent publishes.
Finance Automation Statistics Australia: The Data Finance Teams Need to Know (2026)
If you are a CFO or financial controller evaluating finance automation in 2026, you have probably sat through at least one vendor demo where the presenter…
What Is Finance Automation? A Definitive Guide for Australian Finance Teams (2026)
Most finance teams I speak to are not under-tooled. They have Xero, or an ERP that has been in place for a decade, or SharePoint folders full of invoice PDFs,…
Purchase Order Automation: A Practical Guide for Australian Finance Teams (2026)
If your finance team is still raising purchase orders in a shared inbox, chasing approvals over email, and manually matching invoices line by line before month…